Linear Relations
In this chapter you will learn represent pictorial, oral, and written patterns using linear expressions, equations, and graphs, to interpret patterns in graphs, and to solve problems involving pictorial, oral, and written patterns by using linear equations and graphs.
- When creating a number line, start by placing placing the boundary point in the middle of the number line where it belongs.
-Write the next 3 numbers on each side of that number.
-Draw a circle at the boundary point.
-Shade in the circle if the boundary is Greater than or Equal to, or Less than or Equal to.
-Don't shade in the circle if the boundary is Greater than or Less than.
-Write the next 3 numbers on each side of that number.
-Draw a circle at the boundary point.
-Shade in the circle if the boundary is Greater than or Equal to, or Less than or Equal to.
-Don't shade in the circle if the boundary is Greater than or Less than.
Graphing
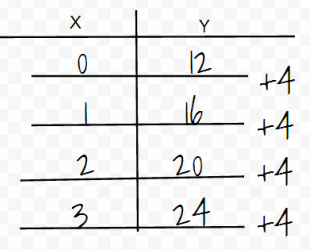
When using a graph to represent a linear relationship the easiest way to to it is with a table of values and then start the graph. This Table of Values represents the equation of 4x+12
When using a graph to represent a linear relationship the easiest way to to it is with a table of values and then start the graph. This Table of Values represents the equation of 4x+12

Graphing
Now when you graph the equation you will use that as a line and the table of values as a reference for the coordinates on the graph.
Now when you graph the equation you will use that as a line and the table of values as a reference for the coordinates on the graph.
When you are trying to make the equation out of the table of values the number that is being added to the (Y) section is going to be the (_x) and then you figure out home many times the (X) section can go into the (Y) section and that will be your (+_ or -_)
